A doji formation is a single-candle pattern and it occurs when prices opened and closed at the same level.
A doji represents equilibrium between supply and demand, a market situation that neither the bulls nor bears are able to win.
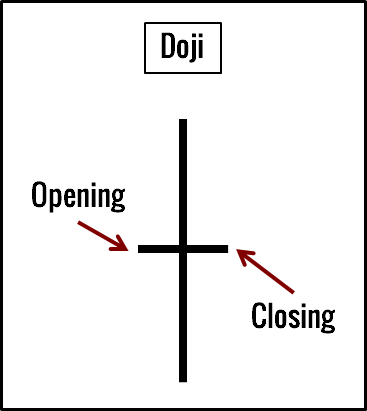
It looks like a cross, with the same opening and closing prices, so the price is basically unchanged, it represents market indecision. It’s like an area of congestion compressed into one candlestick.
Traders should not take action on the doji alone and should always wait for the next candlestick before entering into a long or short position.
It is also important to evaluate if the doji shows up in the early stages of the trend; in this case most probably the doji does not indicate the reversal of the trend but only a pause of the price movement which will probably continue in the same direction.
After a long uptrend, the appearance of a doji can sign that the trend has come close to the peak; similarly, after a prolongued downtrend the doji may indicate a possible bottom.
How do we trade it?
Always wait for the confirmation of the Doji by the next candles and combining it with other indicators such as moving averages crossover, RSI or MACD.
