What are Moving Averages
Moving averages smooth the price data to form a trend following indicator, filtering out wrong signals and whipsaws.
Moving averages lag because they are based on past prices: they do not predict price direction, but rather define the current direction with a lag.
Nevertheless, moving averages are probably the most used tool in trading any kind of financial asset, and as we will see from quantitative researches and analyses, one of the most performing.
As we will se, moving averages can be used to:
- identify the direction of the trend,
- spot precise entry and exit points
- define potential support and resistance levels.
They also form the building blocks for many other technical indicators and overlays, such as Bollinger Bands and MACD amongst others.
The two most popular types of moving averages are the Simple Moving Average (SMA) and the Exponential Moving Average (EMA).
Here’s a chart with both an SMA and an EMA on it:

Simple Moving Average Calculation
A simple moving average is formed by computing the average price of a security over a specific number of periods.
Usually the calculation is made on the closing price.
A 5-day simple moving average is the sum of closing prices of the last five days divided by five. As its name implies, a moving average is an average that moves.
Old data is dropped as new data comes available.
The first day of the moving average simply covers the last five days.
Each following day, the calculation of the moving average drops the first of the five days closing prices and adds the new day closing price.
Each closing price is given the same weight, meaning that in a 10-period moving average the price of day 1 is as important as the price of day 10, even if older.

Exponential Moving Average Calculation
Exponential moving averages reduce the lag by applying more weight to recent prices.
The weighting applied to the most recent price depends on the number of periods in the moving average.
There are three steps to calculating an exponential moving average.
A 10-period exponential moving average applies an 18.18% weighting to the most recent price.
A 10-period EMA can also be called an 18.18% EMA.
A 20-period EMA applies a 9.52% weighing to the most recent price (2/(20+1) = .0952).
Notice that the weighting for the shorter time period is more than the weighting for the longer time period.
In fact, the weighting drops by half every time the moving average period doubles.

The Lag Factor
The longer the moving average, the more the lag.
A 10-day exponential moving average will hug prices quite closely and turn shortly after prices turn.
Short moving averages are like speed boats – nimble and quick to change.
In contrast, a 100-day moving average contains lots of past data that slows it down, and as a consequence it takes a larger and longer price movement for a 100-day moving average to change course.

The chart above shows the S&P 500 ETF with a 10-day EMA closely following prices and a 100-day SMA grinding higher.
The 50-day SMA fits somewhere between the 10 and 100 day moving averages when it comes to the lag factor.
Simple vs Exponential Moving Averages
Even though there are clear differences between simple moving averages and exponential moving averages, one is not necessarily better than the other.
Exponential moving averages have less lag and are therefore more sensitive to recent prices.
Exponential moving averages will turn before simple moving averages.
Simple moving averages, on the other hand, represent a true average of prices for the entire time period.
As such, simple moving averages may be better suited to identify support or resistance levels.
Moving average preference depends on objectives, analytical style and time horizon.
Chartists should experiment with both types of moving averages as well as different timeframes to find the best fit.
The chart below shows IBM with the 50-day SMA in red and the 50-day EMA in green.
Both peaked in late January, but the decline in the EMA was sharper than the decline in the SMA.
The EMA turned up in mid February, but the SMA continued lower until the end of March.
Notice that the SMA turned up over a month after the EMA.

Moving Averages – Lengths and Timeframes
The length of the moving average depends on the analytical objectives.
Short moving averages (5-20 periods) are best suited for short-term trends and trading.
Chartists interested in medium-term trends would opt for longer moving averages that might extend 20-60 periods.
Long-term investors will prefer moving averages with 100 or more periods.
Some moving average lengths are more popular than others.
The 200-day moving average is perhaps the most popular.
Because of its length, this is clearly a long-term moving average.
Next, the 50-day moving average is quite popular for the medium-term trend.
Many chartists use the 50-day and 200-day moving averages together.
Short-term, a 10-day moving average was quite popular in the past because it was easy to calculate.
One simply added the numbers and moved the decimal point.
Having said all that, a study made by ETF HQ shows that:
“As a general rule we can conclude that the Exponential Moving Average is superior to both the Simple Moving Average and the Double Exponential Moving Average”, and
“the 75 Day Exponential Moving Average with End of Week Signals as the ultimate winner because it also produced good returns on the short side of the market”, and
“the 25 Day Exponential Moving Average with End of Day Signals as the ultimate winner for Short trades because it produced the best returns out of the finalists”
Trend Identification
The direction of the moving average conveys important information about prices.
A rising moving average shows that prices are generally increasing.
A falling moving average indicates that prices, on average, are falling.
A rising long-term moving average reflects a long-term uptrend.
A falling long-term moving average reflects a long-term downtrend.
Example of moving averages as indicators of trend

Price Crossovers
The first way moving averages can be used to generate signals is through the very simple crossovers between the price and the moving average.
A bullish signal is generated when prices move above the moving average.
A bearish signal is generated when prices move below the moving average.
You can easily find examples of charts in google images, like those here reported.


Price crossovers can be combined to trade within the bigger trend: the longer moving average sets the tone for the bigger trend and the shorter moving average is used to generate the signals.
That means that one would look for bullish price crosses only when prices are already above the longer moving average.
For example, if price is above the 200-day moving average, chartists would only focus on signals when price moves above the 50-day moving average.
With the 200-day moving average going up and the price above it, a price move below the 50-day moving average would be ignored because the bigger trend is up and would simply suggest a pullback within a bigger uptrend.
A cross back above the 50-day moving average would signal an upturn in prices and continuation of the bigger uptrend.
The next chart shows Emerson Electric (EMR) with the 50-day EMA and 200-day EMA.
The stock moved above and held above the 200-day moving average in August.
There were dips below the 50-day EMA in early November and again in early February.
Prices quickly moved back above the 50-day EMA to provide bullish signals (green arrows) in harmony with the bigger uptrend.

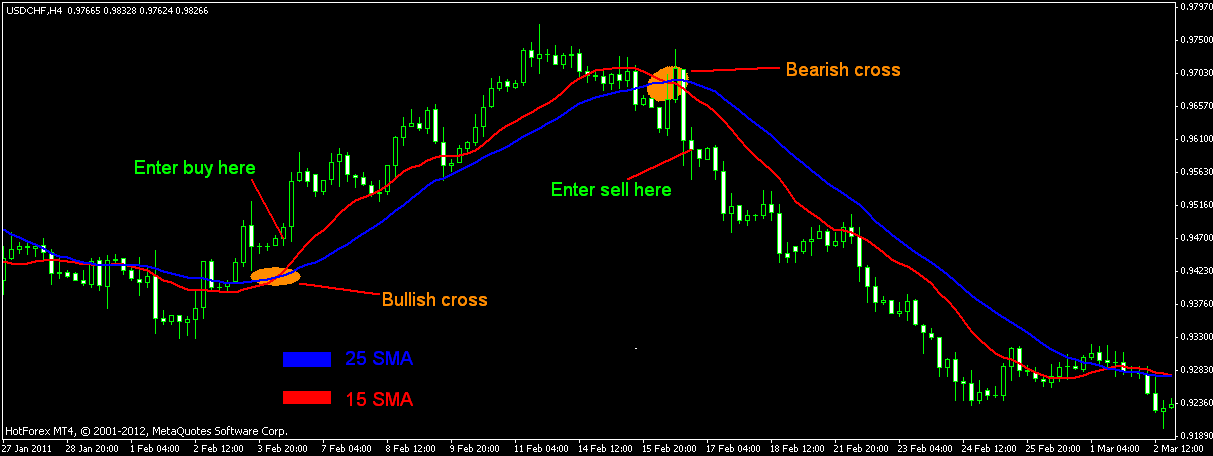
How to use moving averages: Double Crossover
Two moving averages can be used together to generate crossover signals.
In Technical Analysis of the Financial Markets, John Murphy calls this the “double crossover method”.
Double crossovers involve one relatively short moving average and one relatively long moving average.
As with all moving averages, the general length of the moving average defines the timeframe for the system.
A system using a 5-day EMA and 35-day EMA is considered for short-term trading.
A system using a 50-day SMA and 200-day SMA is considered medium-term, and even long-term.
Golden cross: a bullish crossover occurs when the shorter moving average crosses above the longer moving average; this is also known as a golden cross.
Dead cross: a bearish crossover occurs when the shorter moving average crosses below the longer moving average; this is known as a dead cross.
Moving average crossovers produce relatively late signals.
After all, the system employs two lagging indicators.
The longer the moving average periods, the greater the lag in the signals.
These signals work great when a good trend takes hold.
However, a moving average crossover system will produce lots of whipsaws in the absence of a strong trend.
Examples of double crossovers


There is also a triple crossover method that involves three moving averages.
Again, a signal is generated when the shortest moving average crosses the two longer moving averages.
A simple triple crossover system might involve 5-day, 10-day and 20-day moving averages.
There are two takeaways here.
First, crossovers are prone to whipsaws.
A price or time filter can be applied to help prevent whipsaws.
Traders might require the crossover to last 3 days before acting or require the 10-day EMA to move above/below the 50-day EMA by a certain amount before acting.
Second, MACD can be used to identify and quantify these crossovers.
MACD (10,50,1) will show a line representing the difference between the two exponential moving averages.
MACD turns positive during a golden cross and negative during a dead cross.
The Percentage Price Oscillator (PPO) can be used the same way to show percentage differences.
Note that MACD and the PPO are based on exponential moving averages and will not match up with simple moving averages.

This chart shows Oracle (ORCL) with the 50-day EMA, 200-day EMA and MACD(50,200,1).
There were four moving average crossovers over a 2 1/2 year period.
The first three resulted in whipsaws or bad trades.
A sustained trend began with the fourth crossover as ORCL advanced to the mid 20s.
Once again, moving average crossovers work great when the trend is strong, but produce losses in the absence of a trend.
Statistical evidence of the Golden Cross
Best double cross = EMA 13 with EMA 48,5
A recent study by ETF HQ has proven that under specific assumptions the highest returns have been produced by the golden cross between the 13 and 48,5 EMA.
Moving average crossovers have proven themselves to be a powerful and effective form of technical analysis.
However the so called “Golden Cross” of the 50 and 200 day SMA is far from the best.
Our testing revealed that the EMA produces better results than the SMA and the best settings are that of a 13 / 48.5 EMA Crossover.
The long duration of the trades produced, ability to sidestep bear markets and the high probability of profit make it worth testing as a major component in a complete trading system.
Support and Resistance
Moving averages can also be used to spot support levels in an uptrend and resistance levels in a downtrend.
A short-term uptrend might find support near the 20-day simple moving average, which is also used in Bollinger Bands.
A long-term uptrend might find support near the 200-day simple moving average, which is the most popular long-term moving average.
As it is so widely used and common between traders, the 200-day moving average may offer support or resistance simply because almost everybody uses it.

The chart above shows the NY Composite with the 200-day simple moving average.
The 200-day serevd as support in various occasions.
Once the trend reversed with a double top support break, the 200-day moving average acted as resistance around 9500.
You shall not try to use the moving averages as exact indicators of support and resistance levels, but as indicators of areas where the price could bounce up or down.
In the chart below, the price bounced several times in the areas where it hit the 50-day moving average.

Conclusions
The advantages of using moving averages need to be evaluated against the disadvantages.
Moving averages are trend following, or lagging, indicators that will always be a step behind.
On the other side, the trend is your friend and it is best to trade in the direction of the trend.
Moving averages make sure that a trader is trading in the direction of the current trend.
But again, even if the trend is your friend, financial assets price may stay in a trading range scenario for some time, which is not the best price situation to use moving averages.
Once in a trend, moving averages will give you a lot of trading satisfactions.
As we any other trading indicators, also with moving averages you don’t have to pretend to to sell at the top and buy at the bottom.
finally, like for most technical analysis tools, moving averages should not be used on their own, but in combination with other complementary tools.
For exmaples, chartists can use moving averages to define the general trend and then use Stochastics, RSI, MACD or other indicators to define overbought or oversold levels.
We will see in the next pages more indicators and examples of combined use.
Stay tuned