Definition of candlesticks
Candlestick charts are one of the most powerful technical analysis tools in the trader’s toolkit. Most technical analysis programs use candlesticks as the default mode of charting. Used correctly, candlesticks can give a signal in advance of much other market action. They can be a leading indicator of market activity.
Candlesticks date back to the 18th century. Like traditional bars candlesticks indicate for a specific timeframe open-high-low-close prices information but unlike bars candlesticks create patterns that predict price direction.
Proper color coding is another reason why candles carry more information than standard bars.
Among more than 100 individual candlesticks and candlestick patterns, some of them are more reliable than others.
Below are the most viable candlestick patterns, those which prove to have the most relevance in making consistently profitable trading decisions.
Used correctly, they should increase the accuracy of your predictions.
Candle basics
The difference between the open and the close is called the “real body” of the candlestick.
If the candle is green or white, the low is the opening price and the high of the body is the closing price.
If the candle is red or black, the high of the body is the opening price and the low is the closing price.
Candles can cover any timeframe: monthly, weekly, hourly or even a minute.
Although they are relatively reliable, candle patterns should not be used as a stand-alone tool but used in combination with other technical analysis tools, such as moving averages and indicators (like stochastic, CCI).
Top Candlestick Patterns
This set of “The most powerful candlesticks patterns” relies on the work of Thomas Bulkowski, who built performance rankings for candlestick patterns in his 2008 book, “Encyclopedia of Candlestick Charts.”
He offers statistics for two kinds of expected pattern outcomes: reversal and continuation. Candlestick reversal patterns predict a change in price direction while continuation patterns predict an extension in the current price direction.
Hammer and Hanging man patterns
The hammer candlestick pattern is to be considered a strong reversal signal, especially after a prolongued downtrend. It .
The day of the hammer candle, at the start there is strong selling clima, then the price recovers and it closes around the open price, slightly below or above.

Hanging man is exactly the same candle and with the same reversal feature of the hammer but after a long uptrend instead.
The hanging man pattern is a warning of potential price change, but not by itself a signal to go short.
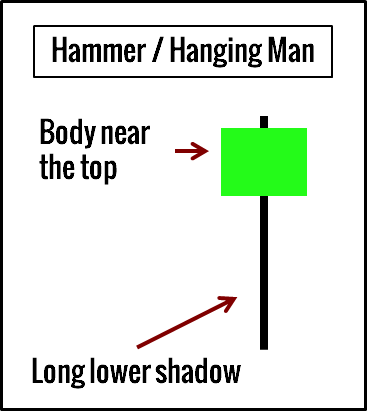
Both the Hammer and the Hanging Man patterns look exactly the same and they both show:
• A candle body near the top of the candlestick; and
• A long lower shadow (around twice of the candle body).
The color of the candle body, whether it be green or red, does not really matter, the information give by these two patterns has the same value:
- The Hammer pattern is found after a market downturn and is a bullish signal,
- The Hanging Man appears at the end of a bull run and is a bearish signal.
What do they mean?
In the Hammer pattern traders who sold in the lower region of the candlestick are then forced to cover their position, contributing to create buying pressure.
The Hanging Man pattern carries the same meaning, but it appears after a long uptrend; it is better to wait for bearish confirmation before going short based on the Hanging Man pattern.
How do we trade it?
1. In a downtrend, buy above the Hammer pattern for a reversal play.
2. In a uptrend, sell below the Hanging Man pattern for a reversal play after bearish confirmation.

Engulfing pattern
The body of the second candle completely engulfs the body of the first.

Again, the focus on the candle bodies looks for a real reversal. In this case, the second candle body fully engulfs the first and represents a strong reversal signal.
How do we trade it?
1. In a bull trend, buy above the bullish Engulfing pattern for bullish continuation.
2. In a bear trend, sell below the bearish Engulfing pattern for bearish continuation.
The bullish engulfing pattern is most significant when it occurs after a prolonged downtrend. The stock or index has been selling off sharply. On the day of the bullish engulfing pattern, prices will often start the day by falling. However, strong buying interest comes in and turns the market around.
The bullish engulfing pattern is so named because the open-close range of this candle surrounds or engulfs the open-close range of the previous one. The bullish engulfing represents a reversal of supply and demand. Whereas supply has previously far outstripped demand, now the buyers are more eager than the sellers. Perhaps at a market bottom, this is just short covering at first, but it is the catalyst that ultimately creates a buying stampede.
When analyzing the bullish engulfing pattern, always be aware of its size. The larger the candle, the more significant the possible reversal. A bullish engulfing candle that consumes several of the previous candles speaks of a powerful shift in the market.
The bearish engulfing pattern is the opposite of the bullish engulfing pattern. Like its companion, it is most significant when it occurs after a prolonged, steady trend. On the day of the bearish engulfing pattern, prices often begin by rising. However, strong selling comes in and turns the market around.
Doji
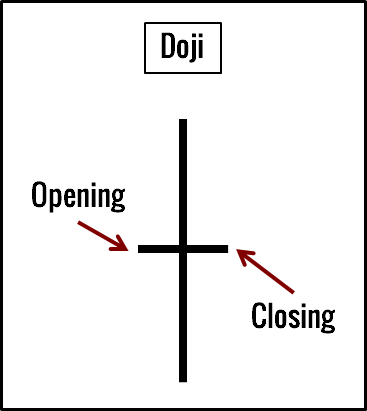
A doji formation is a single-candle pattern and it occurs when prices opened and closed at the same level.
A doji represents equilibrium between supply and demand, a market situation that neither the bulls nor bears are able to win.
It looks like a cross, with the same opening and closing prices, so the price is basically unchanged, it represents market indecision. It’s like an area of congestion compressed into one candlestick.
Traders should not take action on the doji alone and should always wait for the next candlestick before entering into a long or short position.
It is also important to evaluate if the doji shows up in the early stages of the trend; in this case most probably the doji does not indicate the reversal of the trend but only a pause of the price movement which will probably continue in the same direction.
After a long uptrend, the appearance of a doji can sign that the trend has come close to the peak; similarly, after a prolongued downtrend the doji may indicate a possible bottom.
How do we trade it?
Always wait for the confirmation of the Doji by the next candles and combining it with other indicators such as moving averages crossover, RSI or MACD.
